
Rebuilding Head Office Operations Around Stores
When I joined this fashion retailer, the owners were very clear about one thing:
“Head Office exists to serve the shops.”
They believed it was enough to change the name.
“Head Office” became Retail Support Center (RSC) so everyone sitting at HO would remember why they were there:
to support stores so that they can serve customers.
But on the ground, the story was different.
At every regional sales seminar, after we finished the usual slides on sales targets and campaigns, we opened the floor for shop managers.
The first few comments were always polite. Then someone would say what everyone else was thinking:
- “Marketing doesn’t send us material on time.”
- “Audit points stay open for months.”
- “HR doesn’t respond on basic issues.”
- “IT only reacts when we escalate to a senior.”
Different cities. Different managers. Same message.
The name had changed to Retail Support Center.
The experience in stores had not.
As Chief Data & AI Officer, my role was not just analytics; it was to help the business change how it worked using systems and data. The COO’s question to me was very direct:
“We say RSC supports shops. How do we actually see it and manage it?”
Only later did we realize the real problem:
We had built a nationwide retail network on WhatsApp and goodwill.
The invisible problem: 100+ WhatsApp groups
When we started mapping how stores actually asked for help, a clear pattern emerged:
- More than 100 WhatsApp groups with complaints, photos, voice notes, “please fix this” messages.
- Long email threads where multiple departments were copied “for awareness”.
- Verbal follow-ups over phone and corridor conversations.
No one could answer basic questions:
- How many issues did stores raise last week?
- Which departments are slow?
- How many issues are older than 10 days?
- What are the top recurring problems by store?
The conclusion was obvious:
Until support became visible and measurable, nothing would change.
So we designed a practical, low-capex play: extend an existing tool, build simple governance around it, and slowly change behaviour.
Step 1 – Extend the helpdesk to all store issues
We already had a small IT helpdesk for internal tickets (laptops, system access, etc.). Instead of buying a new system, we reused it.
We did three simple things:
- Extended scope
The helpdesk was opened to all store issues, not just IT. - Clear promise back to stores
We told them:
“If you log on helpdesk, we will track and escalate using data. Your chances of getting a real fix will go up.”
- Single rule for stores
Store staff were told:
“If it is not on the helpdesk, it does not exist.”
WhatsApp and email were discouraged for issue logging.
Logging tickets felt like extra work at first, especially for busy shop managers. But the promise of better outcomes – and later, visible results – helped us cross the initial resistance.
Step 2 – Onboard departments and their issue types
Once stores started logging, another gap appeared.
In the system, only IT existed. Marketing, HR, Audit, Renovation, Warehouse, Admin, Procurement, Finance – none of them had queues or categories.
We asked IT to systematically onboard and train every function that receives store issues:
- Marketing
- Sales & Operations
- Audit
- HR
- Warehouse and Quality
- Renovation and Admin
- Procurement, Accounts & Finance, and others
For each department, IT defined:
- A primary POC
- A set of issue types they usually receive from stores (CCTV, printer, POSM delay, staff shortage, salary query, electrical fault, etc.)
In parallel, the Data & AI team built a simple dashboard on top of helpdesk data and plugged it into the Weekly Business Review (WBR).
In the first few WBRs, we asked one question:
“Which departments have zero tickets?”
If a department was missing:
- Store Ops and Sales were pushed to start logging issues for them.
- If the function was not onboarded, IT was asked to onboard it immediately.
Within a few weeks, almost all store-facing departments became visible on the dashboard.
For the first time, we could see who was actually supporting stores – and who was not.
Step 3 – Fix “Miscellaneous” and create meaningful categories
As ticket volume grew, data quality became the next barrier.
A big chunk of issues were tagged as “Miscellaneous”. That meant:
- We could not see what was really going wrong.
- Departments could not spot patterns to fix.
We sat with department reps, reviewed “Miscellaneous” tickets, and turned them into real categories:
- Many Marketing tickets were about campaign material, so we split them into “POSM delay”, “wrong branding”, “campaign not live”, etc.
- General warehouse issues were broken into clear operational categories.
- IT tickets were split into CCTV, printer, barcode scanner, network, and so on.
This looked like a small change, but it transformed the dashboard from a list of tickets into a map of recurring problems.
Step 4 – Attack open rates with simple, public metrics
At this point:
- All major departments were on the helpdesk.
- Categories were good enough to trust.
But about half the tickets were still open.
The average open rate was around 50%.
We introduced a very simple rule in WBR:
“Every week, highlight the Top 5 departments by open rate.”
No shaming, no long lectures – just public visibility in a room where the COO and functional heads sat together.
Behaviour changed quickly:
- Departments started checking their own backlogs before WBR.
- Old tickets that had been forgotten started moving.
- POCs aligned internally to avoid appearing in the “top 5” week after week.
Within a few months, the average open rate fell to below 20%, and some functions brought it near zero.
Step 5 – Solve root causes, not just tickets
Once open rates were under control, the COO shifted the conversation from:
“How many tickets are open?”
to
“Why are these tickets coming in at all?”
Using the cleaned categories, we ranked the top issues for each department and asked them to fix systems, not just close tickets.
A few examples:
- Printer issues
IT discovered that some printer models were consistently unreliable.
We standardized models, upgraded devices, and issued a simple SOP for installation and care. - Barcode scanner issues
Older scanners were failing more often.
All high-risk scanners were proactively replaced across stores. - Electrical issues
We created SOPs for critical electrical problems, clarified vendor responsibilities, and introduced preventive checks.
As these structural fixes went live, ticket volume for those categories started to drop, and store experience became much more stable.
Step 6 – Manage aging and avoid misusing the helpdesk as workflow
Next, we brought time explicitly into the discussion.
We added two simple aging KPIs to the dashboard:
- Tickets older than 3 days
- Tickets older than 10 days
Every week, departments had to explain why 10+ day tickets were still open and what would be done about them.
We also learned an important design lesson:
Not every process should live fully inside a helpdesk ticket.
Some workflows (e.g., complex HR actions or multi-level approvals) were too long and detailed for the ticketing system. For such cases, we:
- Removed those categories in the helpdesk.
- Kept only key milestones logged (request raised, decision made, action completed).
- Ran the detailed process in the appropriate HR or admin workflow.
This kept the helpdesk focused on what it is good at: tracking and accountability, not replacing every internal system.
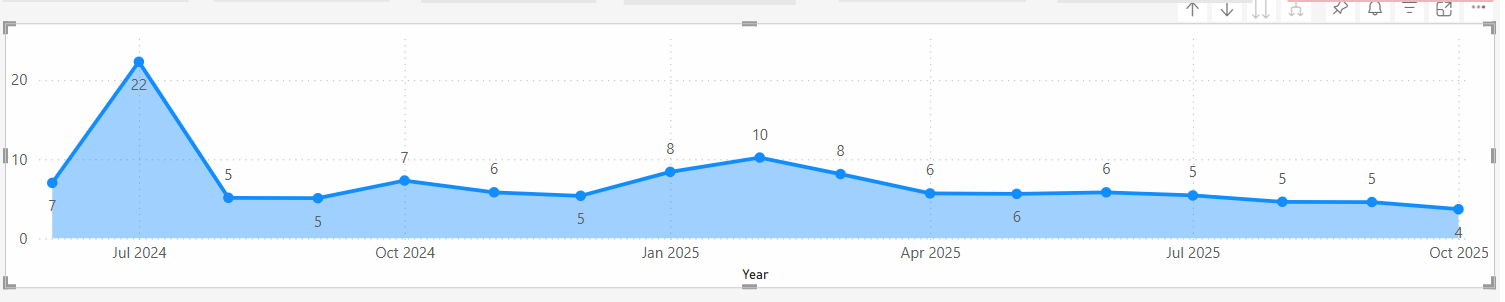
Step 7 – A weekly meeting focused only on delayed tickets
To close the last mile, a director who owned both Sales and HR set up a short weekly operational meeting with a single agenda:
“Review delayed tickets and agree closures.”
No strategy slides.
No long discussions.
Just delayed tickets.
This small governance change had a big effect:
- Average resolution time dropped from 22 days to about 3 days.
- Backlogs stopped silently growing in the background.
- Store managers started noticing that “old problems” were finally being closed.
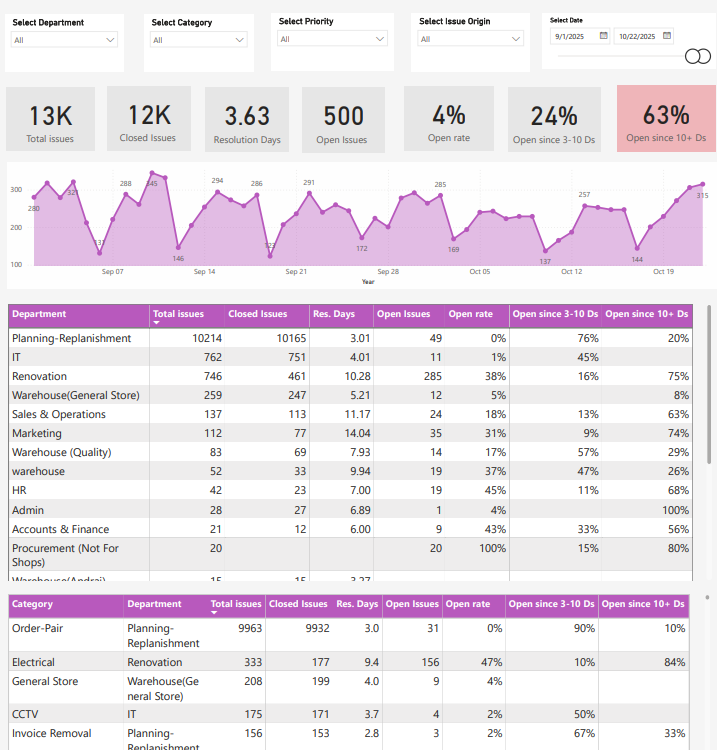
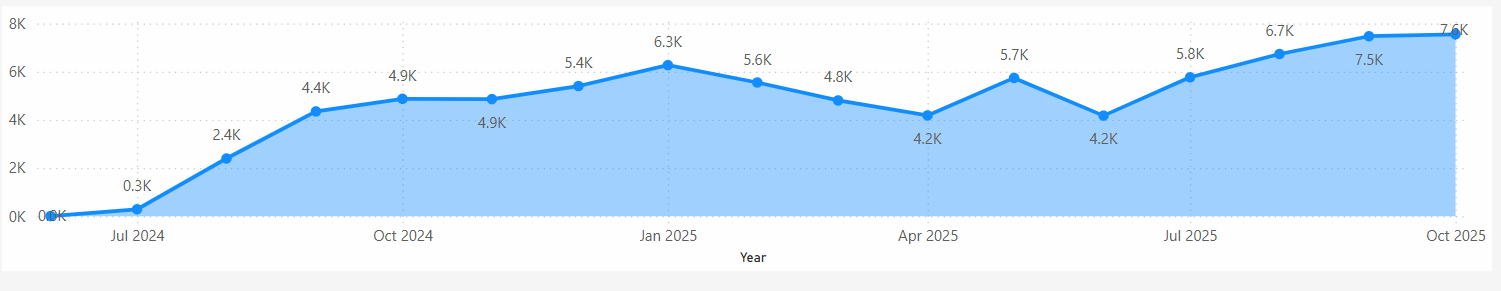
The numbers after scale
Over the full period:
- 80,000+ issues were logged and processed through the helpdesk.
- Average open rate reduced from around 50% to below 20%.
- Average resolution time fell from 22 days to 3 days.
- WhatsApp and email became the exception, not the default channel.
- Feedback from stores and sales staff turned strongly positive on responsiveness.
The original vision of the owners – “RSC exists to support shops” – became visible in numbers, not just in presentations.
Ownership transition: from transformation team to line leadership
The Data & AI Transformation department was very hands-on in the first months:
- We designed the concept and KPIs.
- We drove configuration, onboarding, and early adoption.
- We built the dashboards and integrated them into WBR and MBR.
But for the change to last, this could not remain a “transformation project”.
So we deliberately shifted ownership:
- The COO started reviewing helpdesk stats weekly.
- Sales assigned a manager solely responsible for this initiative.
- Later, the director responsible for Sales and HR began chairing the weekly helpdesk review.
Our team gradually stepped back, allowing:
- RSC functions to fully own and evolve their support processes.
- The transformation team to moving on to the next set of value-creation projects.
This fade-out model ensured the helpdesk became part of the operating model, not just a dashboard run by a project team.
Lessons for CEOs and COOs
Looking back, a few lessons stand out.
1. Cross-functional adoption is the core challenge
The hardest part was not technology. It was getting Marketing, HR, IT, Audit, Operations, Warehouse, and others to work off one shared system.
2. Change management needs time and staged KPIs
Different phases needed different metrics:
- Phases 1–2: % of departments onboarded, number of issues logged.
- Phases 3–4: Open rate and backlog.
- Phases 5–6: Category quality and top recurring issues.
- Phase 7: Resolution time and aging.
This sequencing kept momentum and gave each phase a clear definition of success.
3. Two-sided change is critical
One side (stores) must log issues.
The other side (departments) must respond through the same system.
If either side stays outside, your KPIs are lying.
4. Embedding into WBR/MBR is non-negotiable
Once helpdesk metrics became part of formal business reviews, adoption accelerated. The operating model mattered more than any feature of the tool.
5. Transformation teams must plan their own exit
For sustainable change, Transformation or Data & AI teams should design, incubate, then hand over.
Line leadership must become the long-term owner; otherwise, the initiative dies when the project team moves on.
Member discussion