
The Third Growth Lever: How Basket Analytics Unlocked a 4B Cross-Selling Opportunity
The Legacy Growth Mindset
In most legacy fashion retailers, growth thinking is linear. When leadership sets a target—say, a 20% annual sales increase—the breakdown often looks like this:
- 10% from price increases (inflation and category mix)
- 10% from volume growth
Then comes the question: How do we grow the quantity sold?
Typical answers revolve around:
- Opening new stores or expanding existing ones — capital-heavy and slow.
- Tweaking category portfolios — identifying missing product types or fashion gaps.
Both are valid but limited. When a market is already saturated and physical expansion offers diminishing returns, these levers fail to deliver incremental efficiency. This is where the third growth lever comes in:
- Basket Optimization – increasing items per transaction by designing and selling complete looks instead of isolated products.
A Shift in Lens: From Categories to Baskets
At a 250+ store women’s fashion retailer in South Asia, we found that teams were viewing performance strictly through category-level aggregates. While analyzing sales data at this specific retailer, we found that teams were viewing performance strictly through category-level aggregates.
Shoes were analyzed separately from bags, bags separately from accessories.
But what if we stopped looking at categories in isolation and started looking at how customers actually buy?
We moved to basket-level analysis—examining what combinations of products appear together in the same transaction.
The result was eye-opening.
Finding the Cross-Selling Gap
Over 50% of transactions were single-item purchases.
That means half the customers who entered a store left with just one item—typically a pair of shoes.
Yet customers who bought even two items in the same visit spent 2.4× more (₨ 4,991 vs. ₨ 2,076).
If we could simply shift 20% of single-item shoppers to buy one more complementary product, the business could unlock ~₨ 4 billion in annual revenue—without opening a single new store.
Quantifying the Opportunity
| Quantity Bought | Average Transaction Value (ATV) | Current % of Transactions | Target % | |
|---|---|---|---|---|
| 1 Item | ₨ 2,076 | 50.1 % | 30 % | ↓ |
| 2 Items | ₨ 4,991 | 18.3 % | 38.3 % | ↑ |
Additional Revenue ≈ 1.4 M transactions × (₨ 4,991 – ₨ 2,076) = ₨ 4 billion.
This is a pure behavioral and merchandising opportunity—no capex required.
In practice, the 4B is an upper-bound scenario. Realised uplift depends on how well these operational constraints are handled.
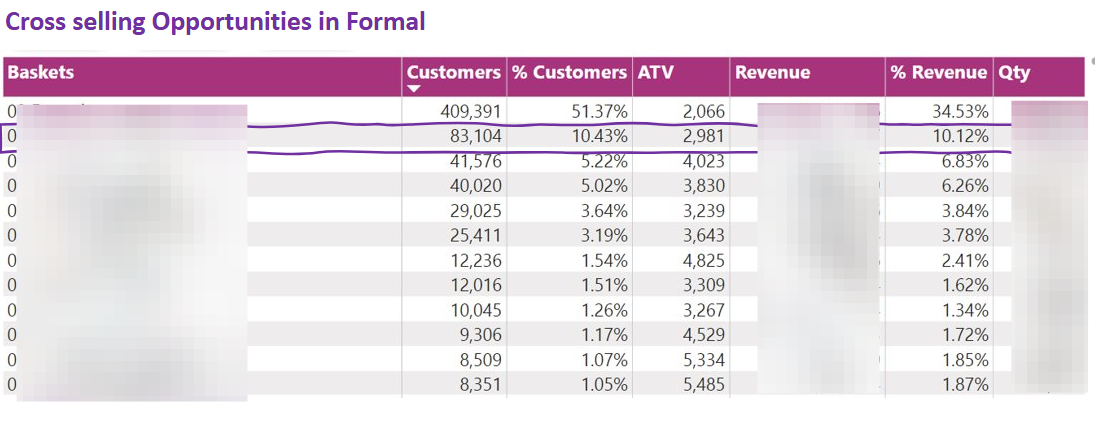
Category Examples
The Cross-selling potential varied by segment, but the pattern was consistent.
- Fancy + Bags: raising pairing from 2.7 % → 5 % adds ₨ 106 million
- Formal + Casual: raising from 10.4 % → 20 % adds ₨ 251 million
- Kids Open + Kids Close: raising from 11.8 % → 20 % adds ₨ 118 million
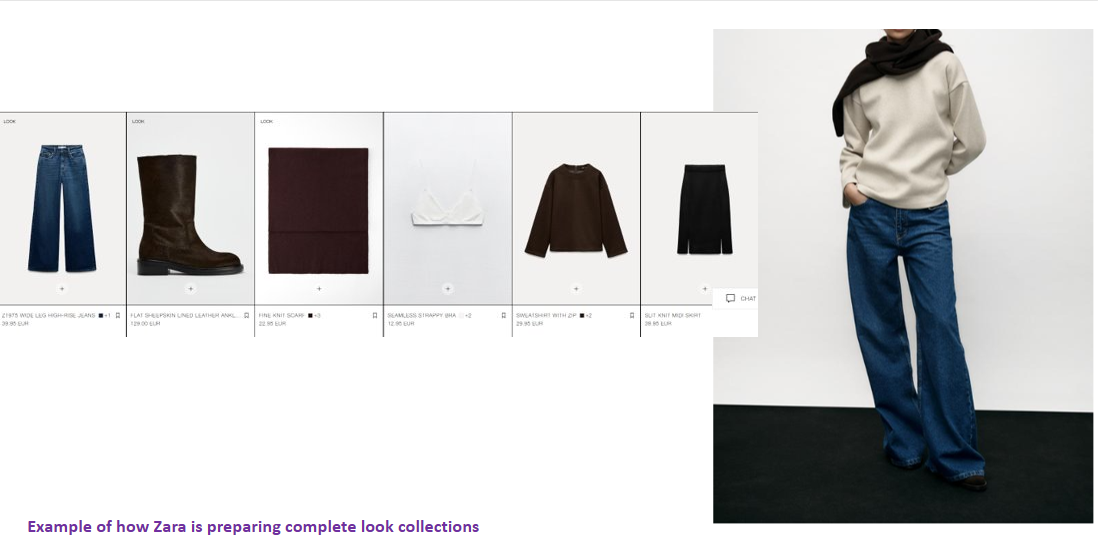
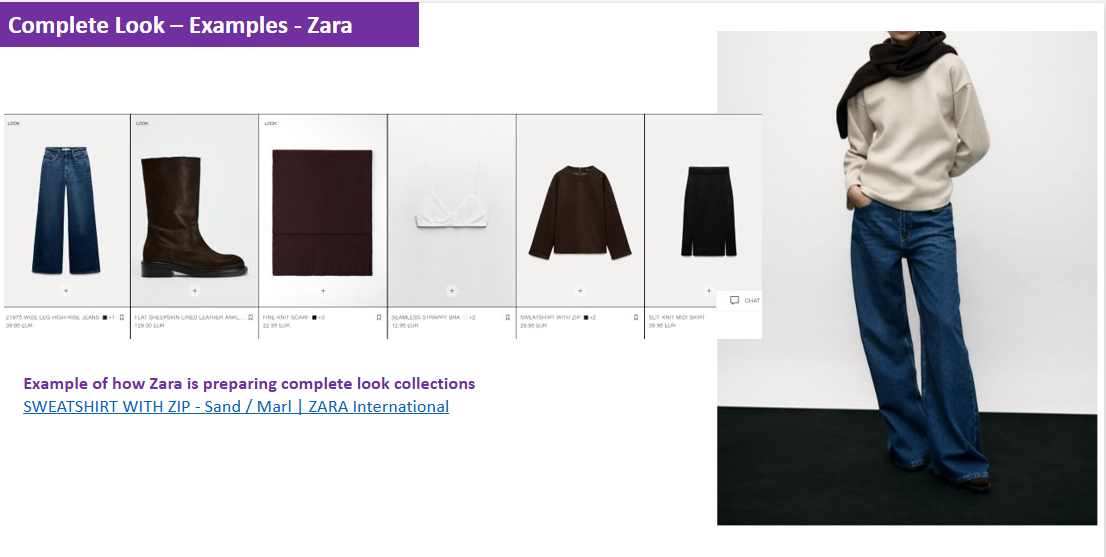
From insight to business model: “Complete Look” merchandising
A finding like “4B uplift in cross-selling” is useless if it stays inside the BI dashboard.
We converted this into a new proposed operating model we call “Complete Look Merchandising”. Instead of organising everything around isolated products, we proposed to organise around looks that solve a full customer job:
- “Office-ready look”
- “Wedding guest look”
- “Winter casual weekend look”
- “Back-to-school kids look”
This required coordinated change across five functions.
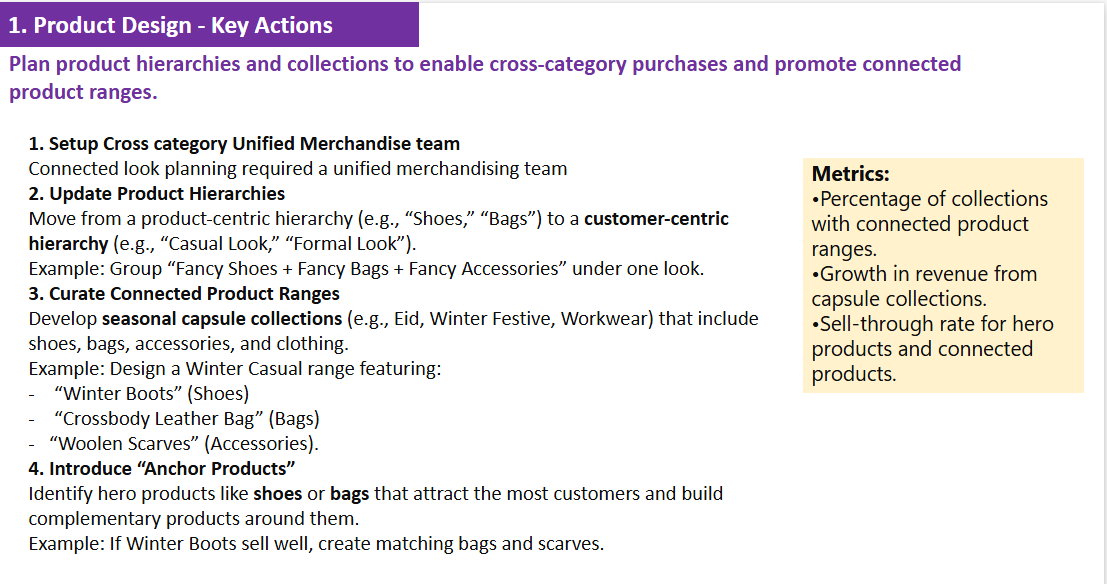
1. Product Design
- Redefine product hierarchies around looks (e.g., “Winter Casual,” not “Boots”).
- Build connected product ranges—coordinated shoes + bags + accessories.
- Metrics: % of connected collections, revenue from capsule ranges, hero-product sell-through.
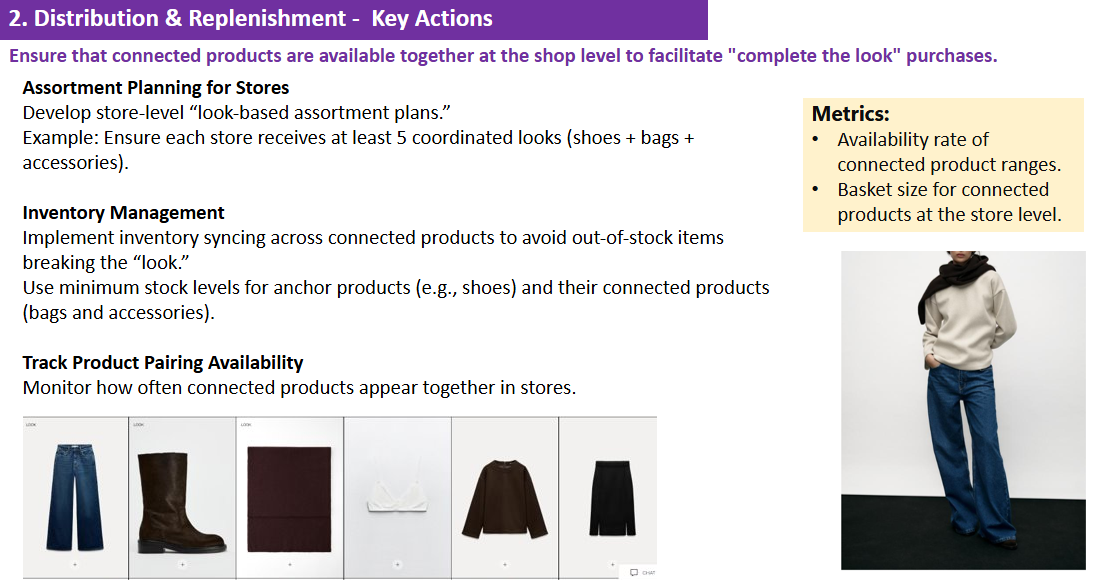
2. Distribution & Replenishment
- Ensure connected products ship together.
- Use store-level look-based assortments—each store must have at least five coordinated looks.
- Metrics: Measure the availability rate of connected ranges and basket size uplift.
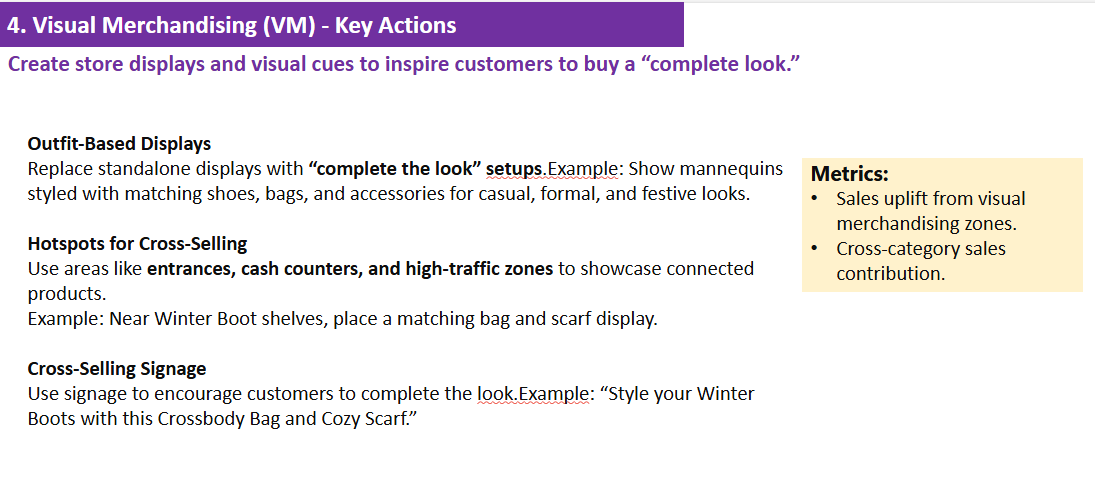
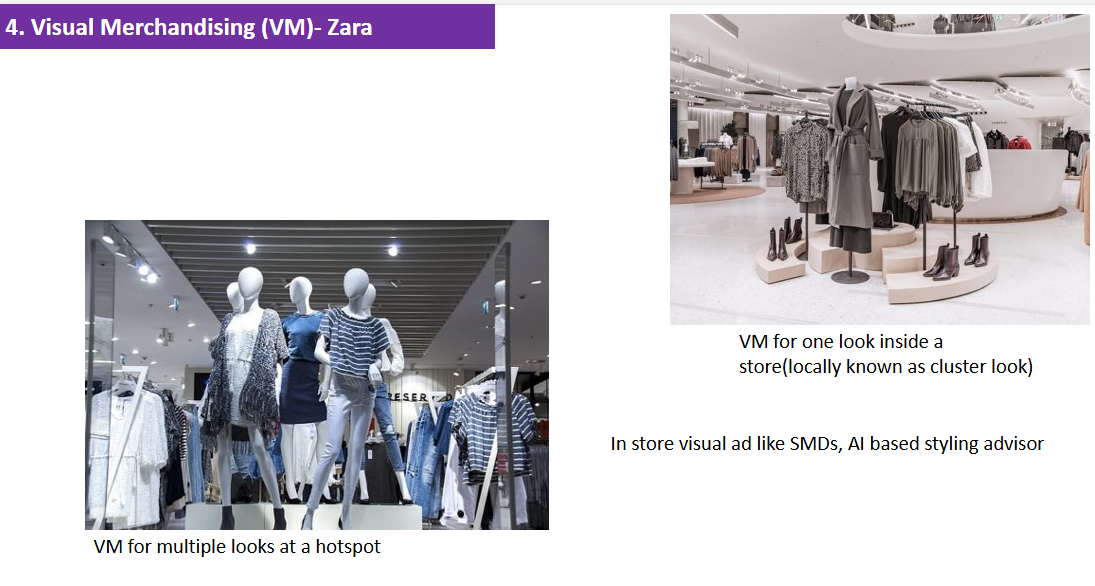
3. Visual Merchandising
- Move from category walls to complete-look displays.
- Place cross-selling signage in hotspots (entrances, cash counters).
- Metric: sales uplift from VM zones.
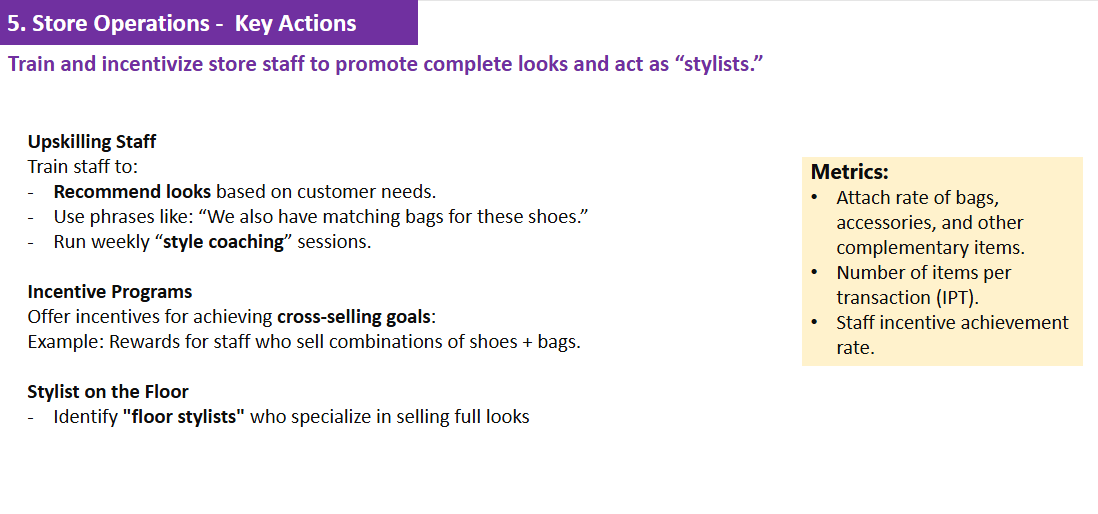
4. Store Operations
- Train staff to act as stylists, not sellers.
- Introduce incentives for achieving cross-selling targets.
- Metric: items per transaction (IPT) and attach rate for bags/accessories.
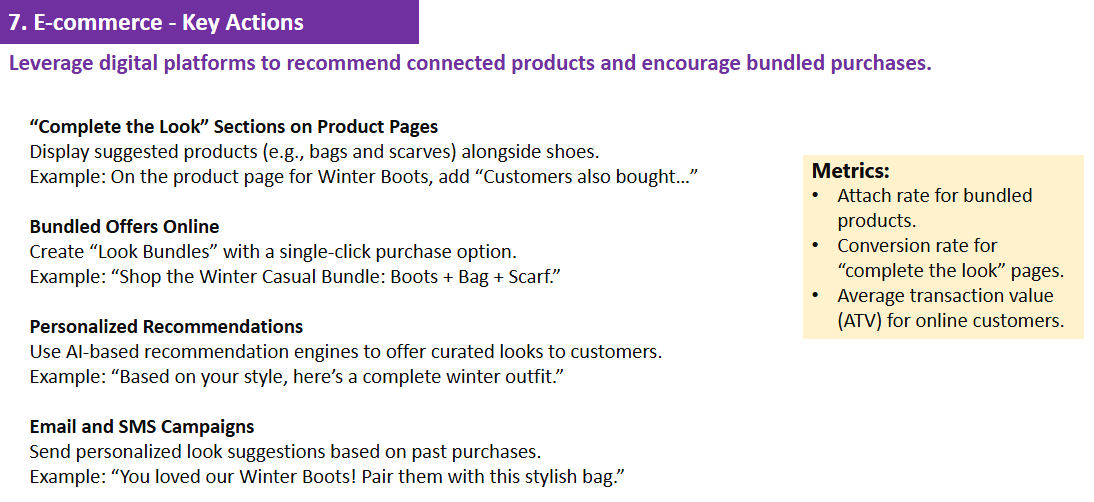
5. Marketing & E-Commerce
- Promote “Complete the Look” bundles across channels.
- Use styling content and digital bundling tools to mirror in-store behavior.

From Data Insight to Business Transformation
The story of this discovery isn’t about analytics alone—it’s about reframing how retail teams think.
Traditional data views revenue as an output problem. But when we look deeper at inputs—basket composition, attach rate, and visual cues—we uncover scalable levers hidden in plain sight.
Cross-selling isn’t just a tactic.
It’s a low-capex growth engine that connects product, store, and marketing teams around one behavioral goal:
Increase items per transaction through connected experiences.
Tech. Approach & Data Stack for accelerated insights
Using 12 months of POS transactions, we rebuilt the view at the basket level: one row per transaction with all items attached. We then:
- Calculated ATV by basket size
- Identified top cross-category pairs
No advanced modelling was needed; the main unlock was changing the grain of analysis.”
The unified medalion architecture-based data platform helped deliver insights in less than 2 weeks and reduced engineering effort by 40%.
- Data Source: Transactions data from D365 sales tables
- Data Platform: Microsoft Fabric-based Delta Lake
- Source Integration: Synapse link
- Tool: Apache Spark
- Effort: 1 data engineer, 1 BI Engineer
This is an example of applied data transformation that moves from dashboards to P&L: by revealing a new lever, quantifying it, and then rewiring how the business plans, sells, and measures every day.
Member discussion